Analysis of Online Marketing Campaigns Effectiveness from A to Z
Many people wonder why the last financial crisis almost hasn’t affected the Internet advertising market, while other industries had huge losses. Some experts said that the industry didn`t have much money, so it had nothing to lose. But other experts said that small and medium businesses (the basis of online advertisers) have not suffered really much.
We think that another answer is truer: Internet advertising allows arranging target expenditure of the advertising budget. You can deliver your advertising message to clearly defined audience at time when this audience is ready to perceive it. Also you can easily define which of advertising channels is the most beneficial, which of your ad texts / graphics / pages … brings more sales.
We will consider the most important aspects of building a complex analysis system of marketing effectiveness (not only online marketing but also offline) in this article. Also we will highlight the most important points you should consider during your work with incoming data.
Setting business objectives and KPI
The first stage is setting business objectives. You should define your company purposes, divide the company to departments. Below is an example of departments and their goals for an online shop:Sales
- purchases percentage increasing
- increasing of products amount in one order
- increasing of an average bill of one purchase
- decreasing of marketing expenses for each purchase
- brand awareness increasing
- growth of conversion rate – turning visitors into buyers
- increasing of repeated purchases amount
- increasing of registrations amount
- increasing of references amount in the network
- increasing of handled calls amount
- growth of conversion rate – turning calls into sales
- consultancy time reduction
- reduction of calls not related to order placing (guarantee, uptime, etc.)
- higher pages download speed
- reduction of downtime of a site
- reduction of unavailable pages amount(the 404-th and other)
- increasing of visits from organic search
- increasing of revenue from visitors who come from search engines
- etc.
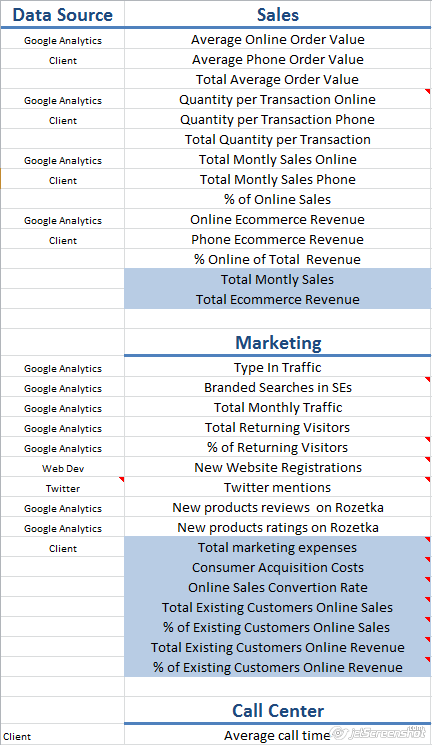
For example, you may use CRM system data to define the amount of purchases; brand search data on Google Analytics and type-in traffic to define brand awareness improvement; the number of “brand” mentions in Twitter during the calendar month to define increasing of references amount in the web, and so on.
As a result, we receive measurable indicators which will help to track the dynamics and understand if we are on the right way.
The result of your work may look like a table containing KPI and methods of KPI getting:
Establishment of a web analytics system
The establishment of a web analytics system is the next step in the effective marketing analysis construction. We recommend using Google Analytics because it is free and easy to operate. It features great functionality to receive almost all necessary data.The installationof this system consists of two simple steps:
- Installation of Google Analytics code (simply adding several code lines to all pages of a site)
- Setting of goals tracking. You need to follow your KPI here. For example, if you need to get data about the amount of new buyers and the quantity of goods in one purchase, you should set two goals: “New customer” and “Successful sale”.
Some tricks that can help to organize tracking of the most common goals:
1) Calls tracking:
- You may set up phone numbers depending on traffic sources
- Your employee may ask users to perform certain action on a site (to press «Thanks for your call» button, to press «CTRL+Enter») which will be defined as the purpose «Successful call»
- A combined method (If the client names, for example, the product code during the call, a special script is executed automatically on his computer)
3) Tracking registered users. If you want to monitor behavior of registered users you may assign users to “custom variables” in Google Analytics while registering on a site, and then segment these users depending on values of these variables.
Advertising campaigns tracking
It is important to track maximum of marketing initiatives, because each of your advertising campaigns influence on your business. For example, it`s better not just to start advertising on TV, but also to control the result. If you notice that advertisement brings sales during, for instance, Champions League Final and brings nothing during an Indian soap opera, then don`t waste money on ineffective advertisement.Let`s consider the most common challenges facing the marketer, who leads audiences to the website of your company:
Оnline campaigns tracking
- Tracking PPC effectiveness
- You may track Google AdWords effectiveness by integrating AdWords into Analytics.
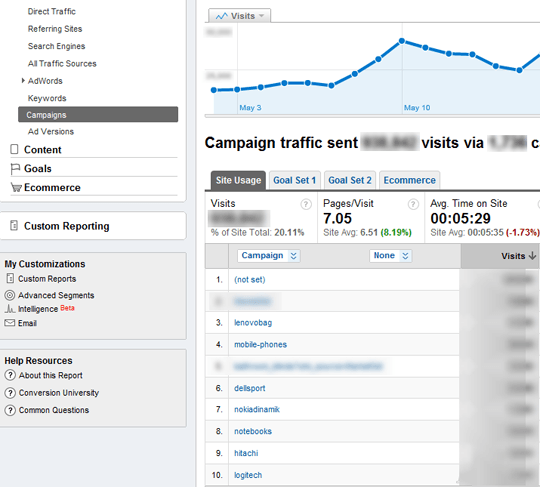
- Other PPC advertising systems (Microsoft AdCenter, FaceBook, MIVA, etc.) can be tracked by marking links with help of the Google and Excel URL builders (so it will be possible to understand exactly, e.g., which campaign in FaceBook and which keywords in Microsoft AdCenter lead to the goals achievement).
- Internal mailing, banner placement, Twitter e. t. c.
Оffline campaigns tracking
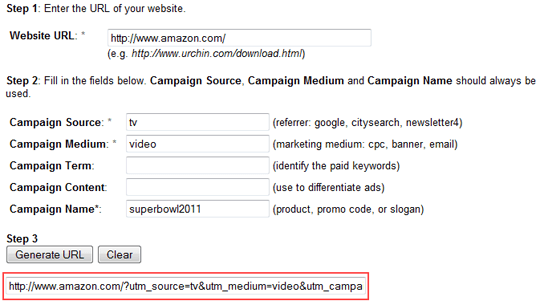
- Creation of marked links with the help of URL builders
- Creation of interim pages with short URL addresses(www.amazon.com/SuperBowl)
- Creation of automatic redirection (a user automatically is redirected through the chain)
http://www.amazon.com/?utm_source=tv&utm_medium=video&utm_campaign=superbowl2011 ->
http://www.amazon.com/
Correct understanding of indicators
Even well configured web analytics system doesn`t guarantee its effective usage.We recommend making reports based on business objectives and KPI you defined at the very first stage. It`s better to avoid abstract formulations like «the bounce rate has decreased by 10 %» or «the number of pages viewed by users has doubled». Try to be more specific.
You should always ask yourself “So what does it mean?” If you don`t manage to reach business objectives after 2 or 3 answers to this question, then this indicator doesn’t play any role.
For example:
- The bounce rate increased by 10%. So what does it mean?
- This causes reduction of page viewed by a visitor by 12%. So what does it mean?
- This causes reduction of income from advertising by 8%. We`ve got the idea! We really need to seek to bounce rate reducing because bounce rate influences advertising revenue.
For example:
The problem is a low number of site visits.

The decision is to try the site search engine optimization.
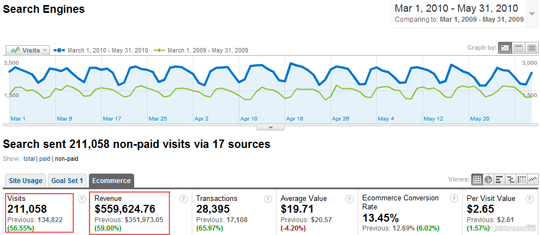
The analysis of results is a report “Visits from search engines. “Visits amount increased by 56% for the three last months, the income from these visitors increased by ~200.000$ (+59%)
You should pay attention first of all to the next top 10 reports:
- Visitors. The report “Map Overlay” allows you to identify the most attractive markets in terms of geography.
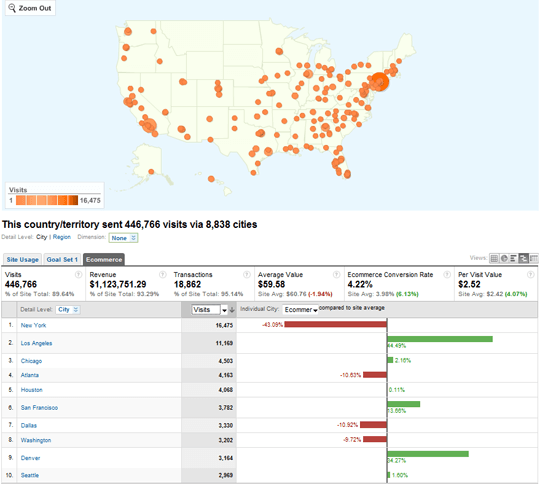
For example, we can see that Los Angeles, San Francisco and Denver convert much better than New York, Atlanta or Dallas.
- E-commerce. The “Overview” Report allows you to define traffic sources and campaigns which give the greatest profit, to see the dynamics of conversions and revenue data for the certain period.
- The report “Funnel Visualization” allows you to identify bottlenecks that cause the greatest difficulty for users on the path to the goal (for example, you can determine that 90% of visitors abandon the process of registration on the second page of a form)

- Traffic sources. The «Google AdWords» reports allow defining which Google AdWords campaigns give the best return of investments.
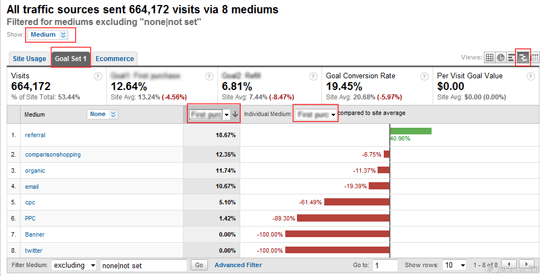
- Traffic sources. «The Source and means» reports allow to compare the conversion of various methods of audience attraction (what the difference between direct, organic, CPC, banner, email etc. is).
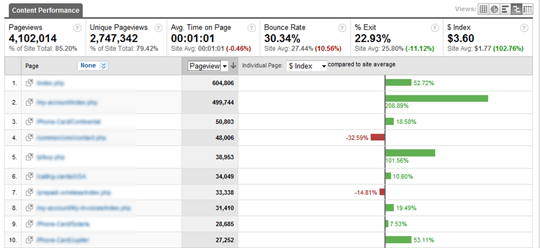
- The “Top Content” report allows to define the most popular pages of your site, and increasing of conversion first of all on these pages; you can also determine which pages generate more revenue and which less (and fix it) using the $index parameter.
- Traffic Sources Report “Keywords” (compared with the previous period) allows you to define which of the most valuable keywords (in terms of sales) began to bring less conversion.
- The report “Search on a site” allows you to identify the most popular topics on your site and to provide users with correct content.
- Traffic sources. The report “Direct Access” allows determining the level of interest in your brand and the dynamics of the core of regular customers (it shows brand queries in conjunction with the report “Keywords”)
- Visitors. “New vs Returning” report allows to define if visitors are interested in a project and whether they are ready to come back there again and again.
Conclusions
- One of the most powerful advantages of online advertising is the ability to define efficiency of each marketing measure.
- You don`t need to buy expensive tools of web analytics because a free tool Google Analytics can solve 99% of problems.
- Try to integrate tracking of all campaigns using the URL Builder.
- Don`t seek to see as much reports as possible during analysis, base the marketing analysis just on your business objectives and KPI.
- Always ask yourself the questions “So what does it mean?”and “What can I do with this?” for better orientation in indicators and umbers. A set of recommendations what to do is the best result of a good analysis.
- Make a list of 10 reports which you will look through to obtain data which is necessary for the development of your business.
Wonderful blog & good post.Its really helpful for me, awaiting for more new post. Keep Blogging!
ReplyDeleteSeo Company San Francisco